Developers using Neovim can now inspect the assembly code of their programs through a dedicated floating window, a feature inspired by the popular Godbolt Compiler Explorer. This integration, provided by the 'AssemblyForNeovim' project, allows users to see how their C, C++, and Rust code is transformed into machine instructions without leaving their primary development environment.
Bridging Source and Machine Code
The AssemblyForNeovim project addresses a common friction point in systems programming: the difficulty of visualizing how a compiler interprets high-level logic. By providing a floating window, the tool allows developers to see the output of the compilation process in a way that mimics the behavior of web-based tools like Compiler Explorer.

Chart drawn by HN Digest from figures reported by github.com; values are shown as written in the source.
This is particularly useful for languages like Rust, C, and C++, where understanding the generated assembly is critical for performance tuning and identifying unexpected compiler behaviors.
Integration with the Neovim Workflow
Unlike standalone tools, this plugin integrates the assembly view into the editor's workspace. This allows for a more fluid transition between writing code and verifying its low-level execution, reducing the cognitive load of switching between different applications.
The floating window design ensures that the assembly view does not obstruct the main workspace, providing a side-by-side comparison that helps developers map specific lines of source code to their corresponding machine instructions.
Debugging and Optimization Context
While the tool is useful during general development, it is most impactful during the debugging and optimization phases. It helps developers verify that specific optimizations are being applied correctly or that the compiler is not introducing unintended side effects.
By seeing the assembly in real-time, developers can better understand how the CPU handles data movement, register allocation, and branching logic, which are often opaque when looking only at high-level source files.
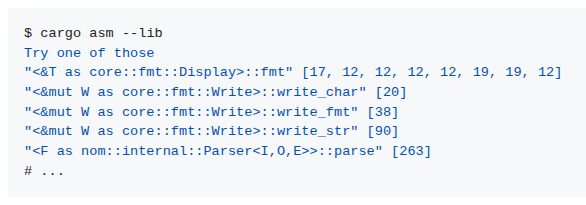
This image provides a visual example of the code listing and development context discussed in the article.
What Hacker News readers are saying
- Experience: One commenter noted that they typically prefer viewing assembly during the debugging phase rather than during the initial development process. comment ↗
- Alternative: Another user suggested that such a tool should be mandatory for any programming environment, ideally paired with a CPU emulator to show clock-by-clock data movement. comment ↗
- Experience: Commenters noted that a contributor mentioned that the plugin's Rust-to-assembly handling has undergone significant work to manage various edge cases and Windows-specific issues. comment ↗
Summarized opinions from the Hacker News thread, not verified facts. Read the full discussion ↗