Microsoft has released a native macOS implementation of its well-known Sysinternals Process Explorer, providing a high-granularity alternative to the standard Activity Monitor. Built using Swift and SwiftUI, the tool brings a familiar Windows-style workflow to the Mac, allowing users to inspect live process trees, modules, handles, and threads with a level of detail that exceeds standard system utilities.
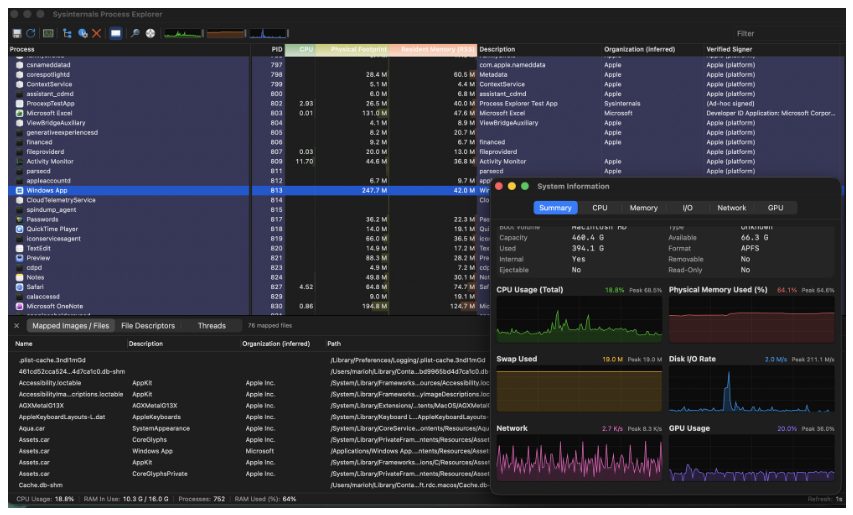
This visual supports the description of the app's specific UI features, such as the live process tree and the lower-pane for inspecting modules.
Core Functionality and UI
The application replicates the core Process Explorer experience by offering a live process tree and a frozen process-name pane with horizontally scrollable metric columns. It supports immediate tooltips for truncated cells and provides a pause/resume refresh feature to allow for static analysis of the process list.
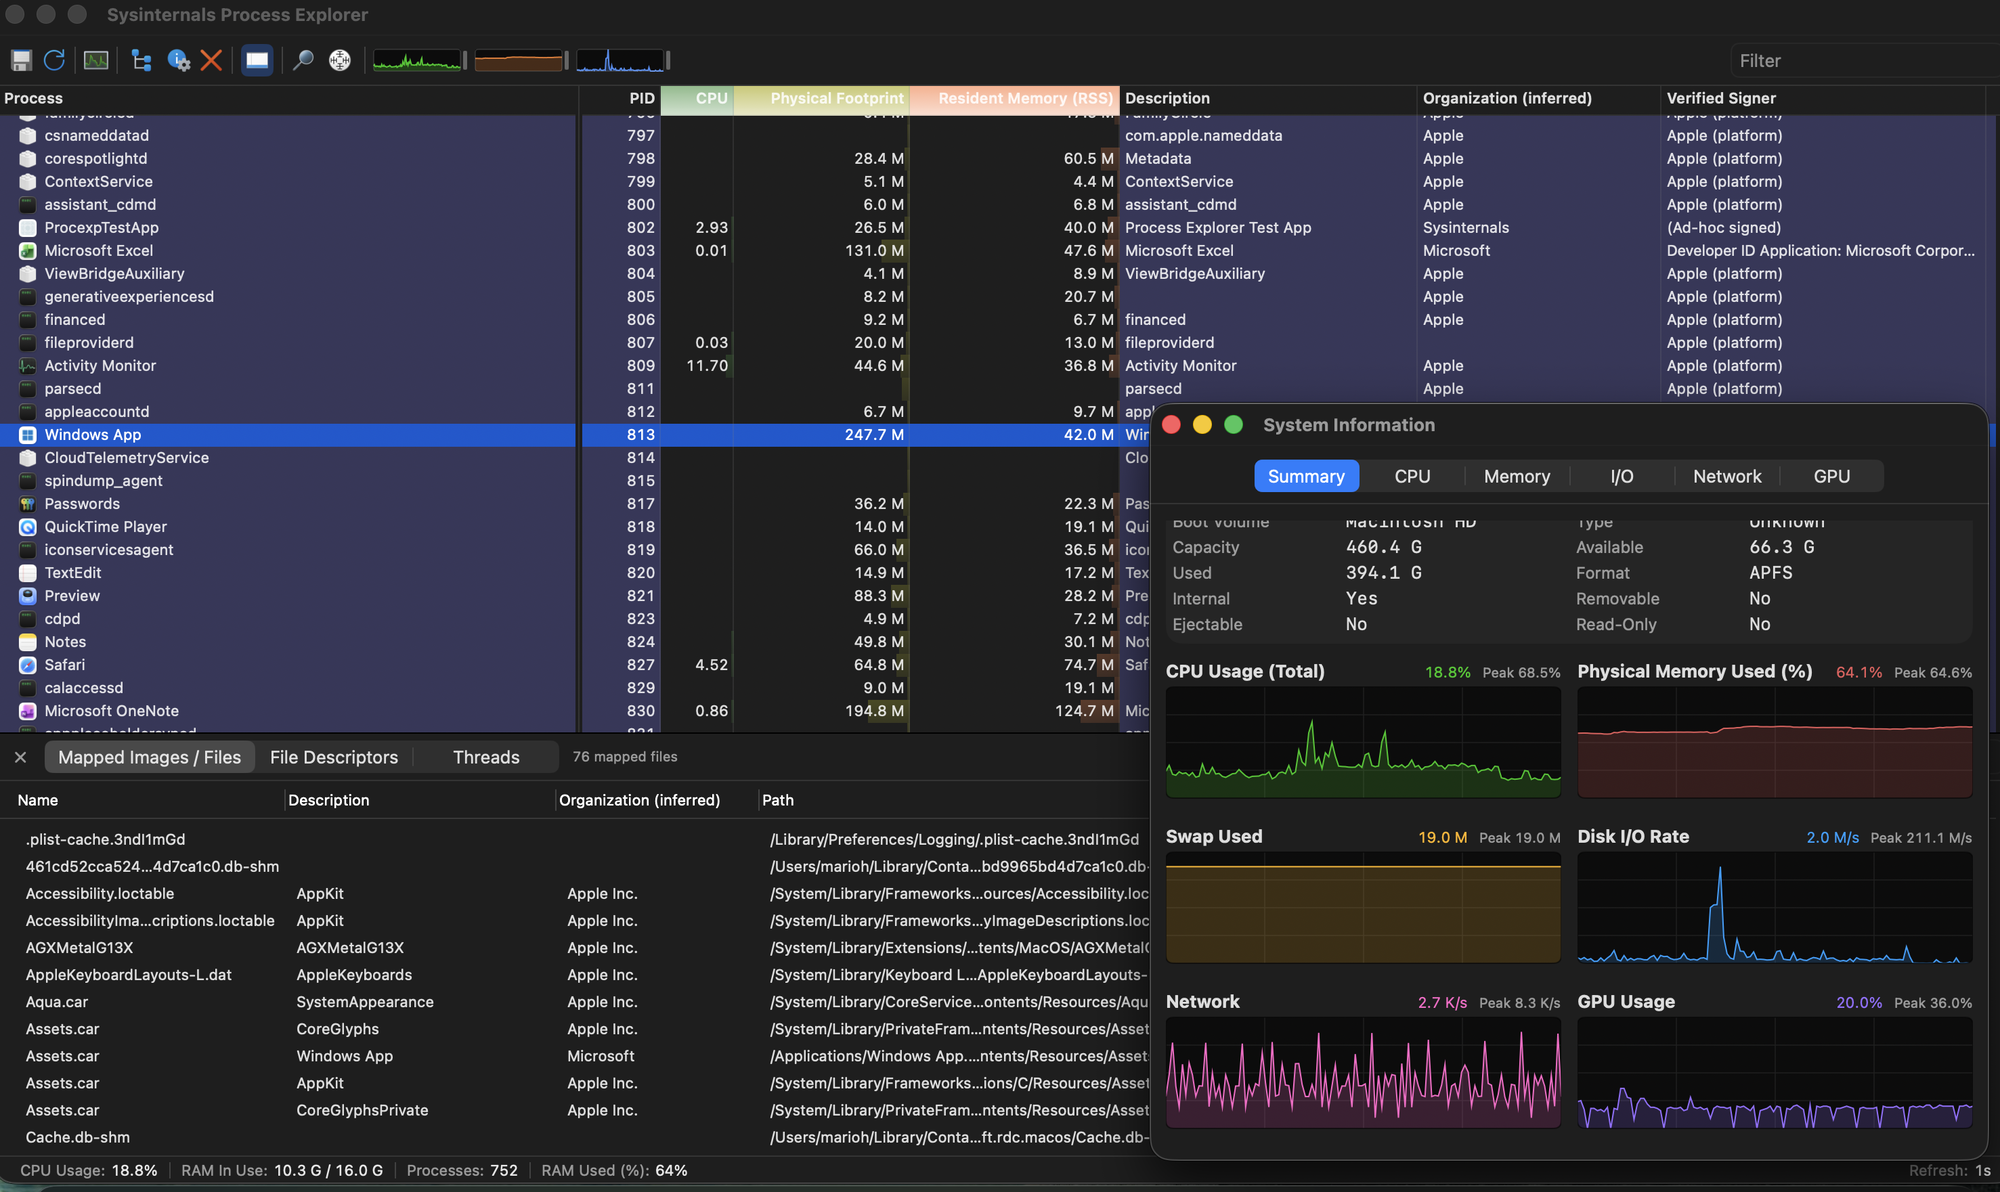
This image illustrates the primary interface of the new macOS application, showing the process tree and system metrics described in the core functionality section.
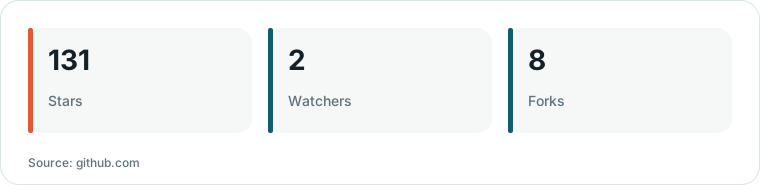
Chart drawn by HN Digest from figures reported by github.com; values are shown as written in the source.
Users can interact with the data through type-to-select functionality in both the process and lower-pane lists. The interface includes a dedicated System Information window that displays summary data and graphs for CPU, memory, swap, disk I/O, network I/O, and GPU usage.
“Sysinternals Process Explorer for Mac is a native macOS implementation of the core Process Explorer experience.”
— GitHub - microsoft/Procexp-Mac: Process Explorer for MacOS
Technical Architecture and Data Sources
The app is built on a modern stack of Swift, SwiftUI, and AppKit. It gathers system data through public macOS APIs, including libproc, sysctl, Mach host statistics, Security.framework, IOKit, and Metal.
To handle operations that require elevated privileges, such as viewing full process lists for all users or performing privileged process control, the app utilizes an optional privileged helper. This helper is a launchd daemon reached over XPC, which users can approve via System Settings.
Advanced Observability and Security
Beyond basic process listing, the tool offers a TCP/IP tab that shows local and remote addresses, TCP states, and performs async reverse-DNS lookups. It also provides a Security/signature tab that displays the signer, certificate chain, Team ID, and notarization status.
For module and image inspection, the app provides metadata, signature verification, and direct links to 'Reveal in Finder' or 'Search Online.' It also includes VirusTotal integration to check the reputation of specific images and processes.
Limitations and Trade-offs
Because macOS does not expose every data source through public APIs, the application leaves certain values blank rather than fabricating data when access is denied. Some metrics are only available for same-user processes or when the privileged helper is active.
The tool is designed for deep observability, which may result in a UI that feels less 'native' to macOS users compared to standard system tools. However, it provides significantly more data points, such as file handles and syscall-related information, which are often missing from the default Activity Monitor.
What Hacker News readers are saying
- Technical note: One commenter who tested the software reported that the application appeared to be in an early alpha state, noting that the interface became blank after installing the required privileged helper. comment ↗
- Technical note: A user who experienced issues with the tool's functionality noted that sorting by CPU and switching between view modes did not seem to be working correctly. comment ↗
- Technical note: One commenter suggested that the tool could be a useful alternative to the standard Activity Monitor, which they found to be lacking in features and slow to load. comment ↗
- Technical note: Another user shared their experience developing a similar tool for Linux, highlighting how they handle process detection and permission limitations. comment ↗
Summarized opinions from the Hacker News thread, not verified facts. Read the full discussion ↗