During a nationwide FAA ground stop on November 13, 2026, an independent tracking tool provided a live visual representation of the 'missing' flights in U.S. skies. By comparing current airborne counts to the same time on a previous Friday, the platform demonstrated how quickly commercial flight volume dropped following the 3:54 PM ET shutdown.
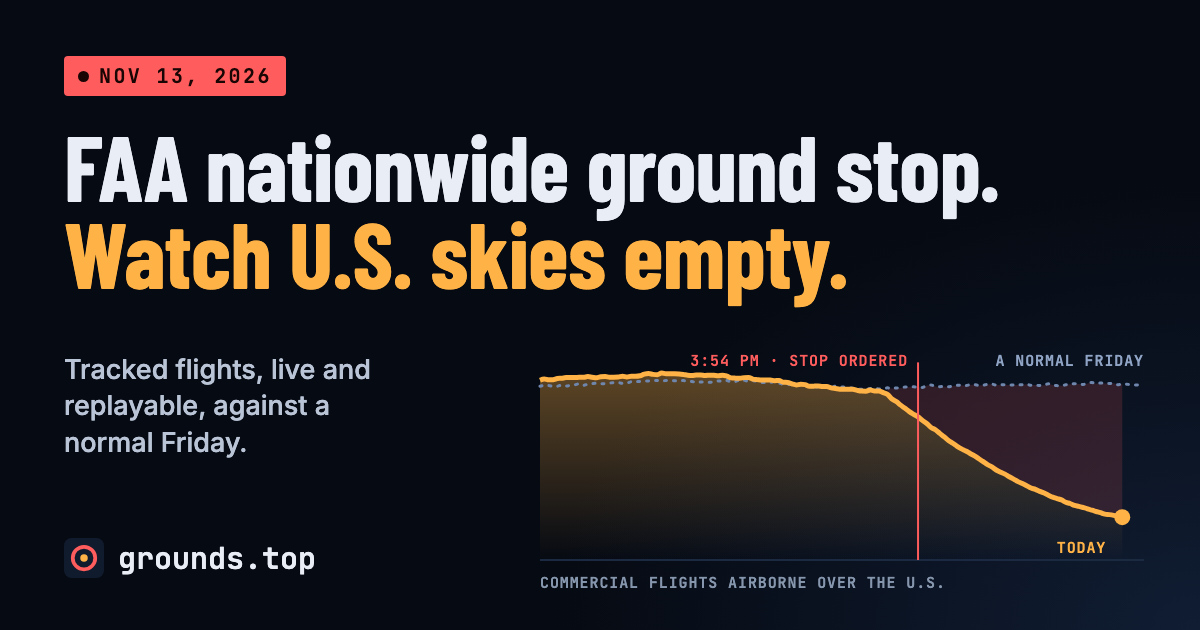
This image illustrates the core functionality of the grounds.top platform, showing the 'missing' flights compared to a normal Friday.
The Ground Stop Watch Platform
The project, hosted at grounds.top, provides a live map and timeline to replay the shutdown's progress. It categorizes commercial flights by altitude—below 10,000 ft, 10,000 to 28,000 ft, and above 28,000 ft—to show how different flight paths were affected.
The platform's data is derived from the adsb.fi community ADS-B network rather than official FAA feeds. This allows the tool to function even when official systems experience outages, as ADS-B signals are broadcast directly by the aircraft themselves.
“An independent, unofficial page, not affiliated with the FAA.”
— Ground Stop Watch: the FAA nationwide ground stop, live and replayable
Visualizing the Impact and Recovery
To quantify the disruption, the tool compares the number of airborne aircraft at any given moment to the number present at the same time a week earlier. It also tracks 'departures missed' since the 3:30 PM ET stop, providing a running count of the backlog for the 16 largest airports.
Recovery is defined by a specific metric: an airport is considered 'back' once it holds three-quarters of its usual departures for two readings in a row. This provides a data-driven way to see which hubs are returning to normal operations first.
Hacker News Discussion and Technical Context
The author of the project shared the tool on Hacker News, noting that the initial concept was inspired by a GIF of 9/11 flights and was developed in approximately 30 minutes using Claude Code before being cleaned up and deployed.
Commenters on Hacker News discussed the technical irony of the situation, with one commenter, writing as cobychapple, noting that while the FAA lost radar and frequencies between centers, the ADS-B system likely allowed hobbyist receivers to maintain the full picture. Another commenter, krferriter, questioned whether the tool captures general aviation VFR craft, which might still be allowed to fly outside of ATC-controlled strips.
Limitations and Data Boundaries
The platform explicitly states that it is an independent, unofficial page and is not affiliated with the FAA. It relies on tracking data for its calculations rather than official announcements, which may lead to discrepancies during rapid status changes.
Because the tool focuses on scheduled commercial routes to establish a baseline, it may not accurately reflect the behavior of non-scheduled general aviation. Furthermore, the 'departure backlog' is an estimate based on the difference between historical tracking data and current observations.