WaveDudeNext provides a visual platform for exploring wave optics by allowing users to place light sources and optical parts on a canvas to observe how waves propagate as both a swinging field and a time-averaged intensity. Developed by Alexander Gräf, the tool enables researchers and hobbyists to see complex phenomena like diffraction and interference unfold dynamically on a 2D plane.
Core Mechanics and Visualization
The simulator provides two simultaneous views of the wave physics: the 'field,' which shows the wave swinging positive and negative, and the 'intensity,' which represents the wave's energy averaged over time. This dual view helps users distinguish between the instantaneous state of the wave and its cumulative energy distribution.
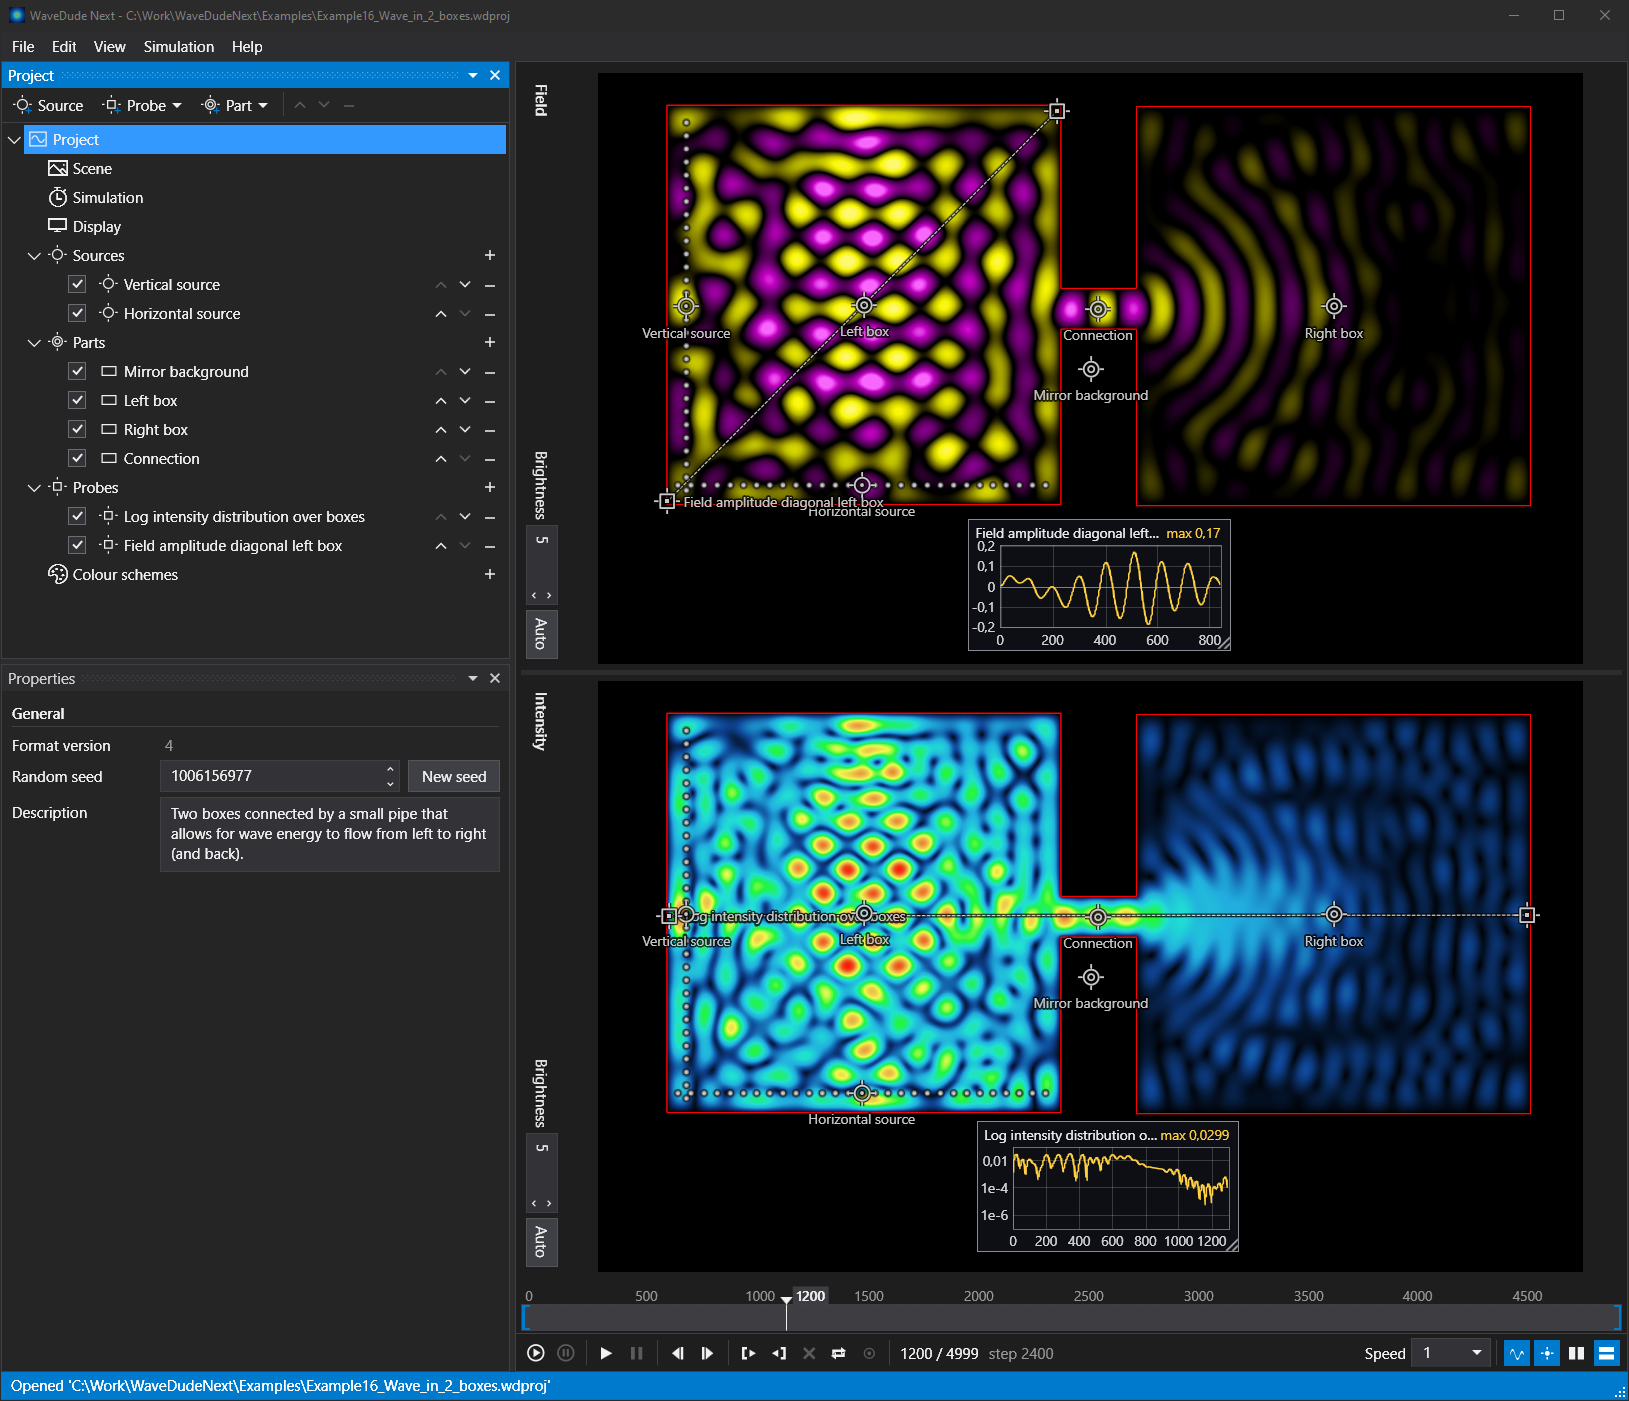
This image illustrates the primary interface of the WaveDudeNext simulator, showing the project management tools and the dual-view visualization of wave physics.
To collect specific data, the tool includes probes that record field or intensity values at a specific point or along a line. These probes generate graphs with linear or logarithmic axes that can be overlaid on the simulation, allowing for precise measurement of wave behavior at specific coordinates.
“You place light sources and optical parts on a canvas and watch how the waves propagate, as the field itself and as the intensity they build up, while the simulation runs.”
— GitHub - graealex/WaveDudeNext: Interactive 2D wave optics simulator. Turn any image into a refractive scene, add source
Expanded Optical Components and Scene Creation
WaveDudeNext introduces a variety of complex optical components that can be shaped and moved using on-screen handles. These include spherical lenses, mirrors, and fibers along curves, as well as specialized elements like gradient-index lenses, zone plates, and Bragg reflectors.
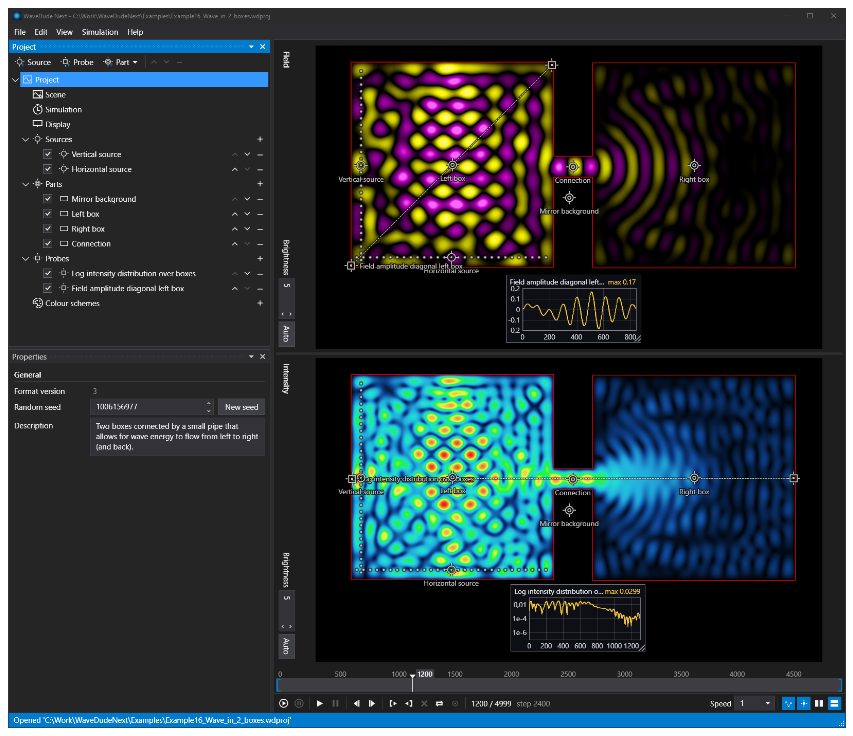
This screenshot provides a concrete example of the software's capabilities, including the timeline and the side-by-side field and intensity views.
A unique feature allows users to turn any image into a refractive scene. By using a specific color mapping—red for refractive index, green for emitters, and blue for absorption—the software embeds the image into the project and refreshes the simulation automatically as the file is edited.
Performance and Export Capabilities
The simulation runs on the GPU when available, falling back to the CPU otherwise. To ensure usability across different hardware, the software automatically selects a preview quality that suits the machine's power, while ensuring that all exported files maintain full quality.
For analysis and presentation, the tool supports a wide range of export formats, including MP4, AVI, and QuickTime for video, as well as PNG, JPEG, and OpenEXR for raw data. OpenEXR files are specifically designed to carry raw values for use in external tools like NumPy, MATLAB, or Octave.
Technical Limitations and Requirements
While the simulator offers high-fidelity previews, the memory footprint can be significant; a run of 1500 Full HD frames can occupy between 740 MB and 11.6 GB of space. To manage this, the software includes a frame cache that spills to disk when the run exceeds available memory.
The software is currently limited to Windows 10 and 11. While it provides a 'small' executable that requires the .NET 10 Desktop Runtime, it also offers a larger standalone version that includes the runtime to simplify the installation process for users.