The project 'The Climb,' hosted by Dream Again USA, provides a visual representation of wealth inequality in the United States by drawing household net worth to a literal scale. The interactive experience is designed so that each pixel represents $5,000 in wealth. This scaling method highlights a stark disparity: while the median household's wealth is represented by a relatively small stack, the wealth of the top 1% is so substantial that users must scroll for several minutes to reach the top of the graph. The project includes a printable PDF version and a video component to help users visualize these figures in a tangible way.
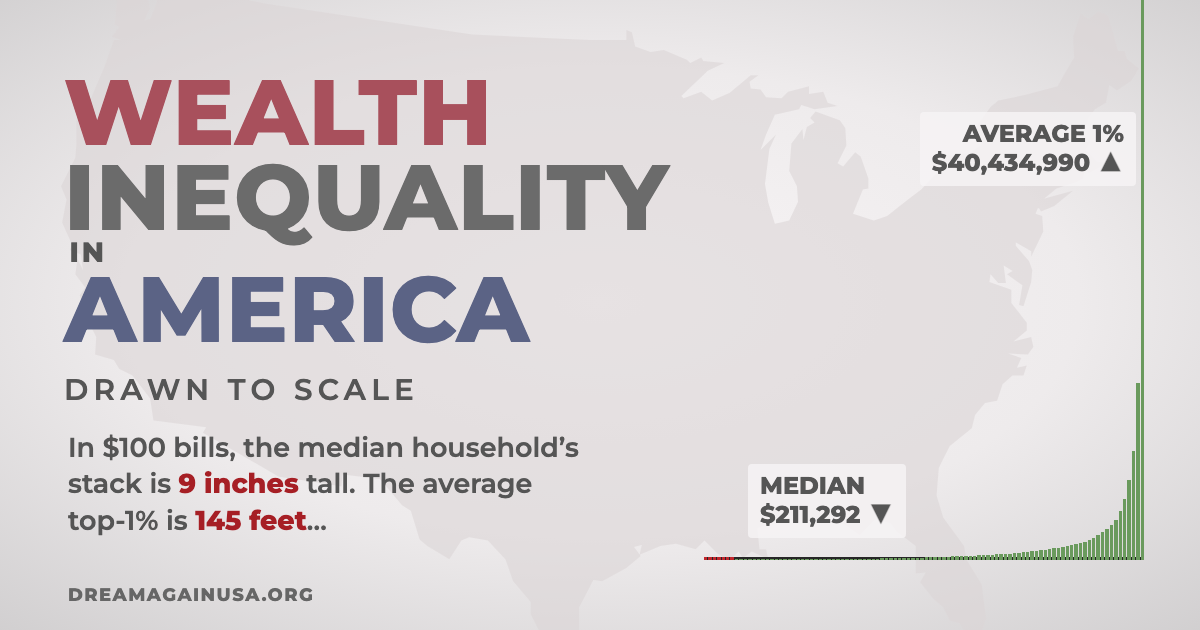
This image provides a direct visual representation of the scaling method described in the project, showing the massive height difference in wealth stacks.
To provide context for these figures, the project uses data from the 2023 Survey of Consumer Finances, adjusted to 2026 dollars. The visualization illustrates that the average top 1% household holds a wealth stack that is significantly taller than the median household's stack—the median is described as being about 9 inches tall in a physical representation, while the top 1% average is 145 feet tall. The graph also accounts for the poorest 8% of households by including their reported debt, providing a more comprehensive view of the economic spectrum.
While the visualization offers a clear look at current wealth distribution, it also highlights the complexities of interpreting wealth as a metric for social standing. For example, the project notes that many individuals may have a negative net worth due to student loans or other debts, particularly during early career stages, which can skew perceptions of poverty. Furthermore, the data distinguishes between personal net worth and the estimated value of companies owned by ultra-wealthy individuals, noting that corporate valuations do not always equate to personal liquid assets. By providing both an interactive experience and a 'Companion' PDF with every underlying number, the project aims to make the abstract concept of wealth inequality more accessible and measurable.