The engineering team at Layers successfully reduced the file size of 103,802 hand-placed dots from a massive 175 MB of Illustrator exports down to just 82 KB. This optimization was necessary to ensure that complex, interactive illustrations could render smoothly on lower-end devices without jitter or lag.

This image illustrates the final output of the hand-placed dots used in the Layers interface.

The chart visualizes the massive reduction in geometry delivery achieved by the engineering team.
Identifying Data Redundancy
The original artwork, created by pattern designer Alberto Larizza, consisted of over 100,000 dots. When exported as SVGs, these dots were represented as a mixture of circles, ellipses, and paths, resulting in a massive 175 MB of source data.
Analysis of the data revealed a significant structural pattern: because the artist built the patterns row by row, 78% to 99% of dots shared the exact same Y-coordinate. Conversely, the X-coordinates remained high-entropy, with nearly every value being fractional.

This visual explains the structural pattern of the data where dots share the same Y-coordinate.
“Planes did the majority of it actually (more than half off). Once it’s its own stream Brotli will see thousands of repeated row values in a row.”
— Shipping 103,802 Dots in 82 KB
The DOT2 Binary Format
To shrink the data, the team developed 'DOT2,' a custom binary format. The process involves quantizing coordinates to uint16, scaling radii to uint8, and storing values as deltas from the previous dot. Crucially, the data is stored in 'planes'—all X deltas, then all Y deltas, then all radii—rather than interleaved.
This planar layout allows the Brotli compression algorithm to see thousands of repeated row values in a single stream. While deltas provided a small gain, the planar organization accounted for more than half of the total size reduction, bringing the final compressed size to 82 KB.

This diagram illustrates the planar organization of the custom binary format.
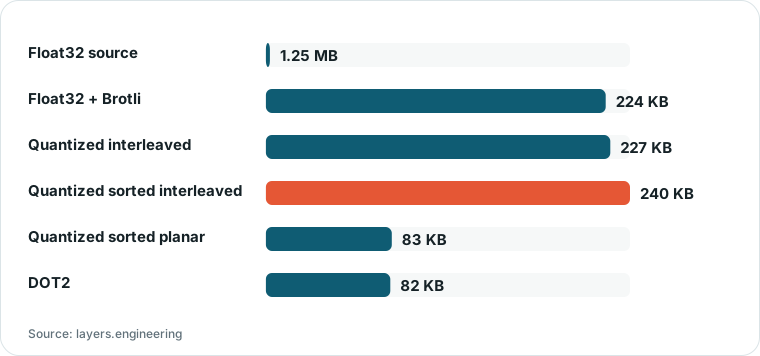
Chart drawn by HN Digest from figures reported by layers.engineering; values are shown as written in the source.
The format is lossy, but the team verified that the maximum coordinate error remains below 0.011px and the radius error is less than 0.0065px, which is imperceptible to the user.
Runtime and Rendering Optimizations
Beyond reducing the wire format, the team optimized how the browser handles the dots. They moved from an object-based system—where each dot was a JavaScript object with eleven fields—to ten flat typed arrays (Float64Array). This ensures that the spring physics calculations remain bit-for-bit identical to the original prototype.
The team also overhauled the background grid rendering. The old loop visited every cell in the grid every frame; the new loop only visits active cells and the specific bounding box of the user's cursor. This change allows the page to stop requesting animation frames entirely when the grid is idle.