Users of self‑hosted software or SaaS products increasingly ask to send logs, traces, and metrics to an observability stack of their own choosing, whether to satisfy compliance, control costs, or centralize data. When a product locks them into its built‑in dashboards or limits exports to specific vendors, it creates unnecessary friction. An OTel‑native approach avoids this by designing the product to push telemetry to any OpenTelemetry‑compatible endpoint over the standard OpenTelemetry Protocol (OTLP), giving users the freedom to select their preferred backend without requiring custom adapters for each system.
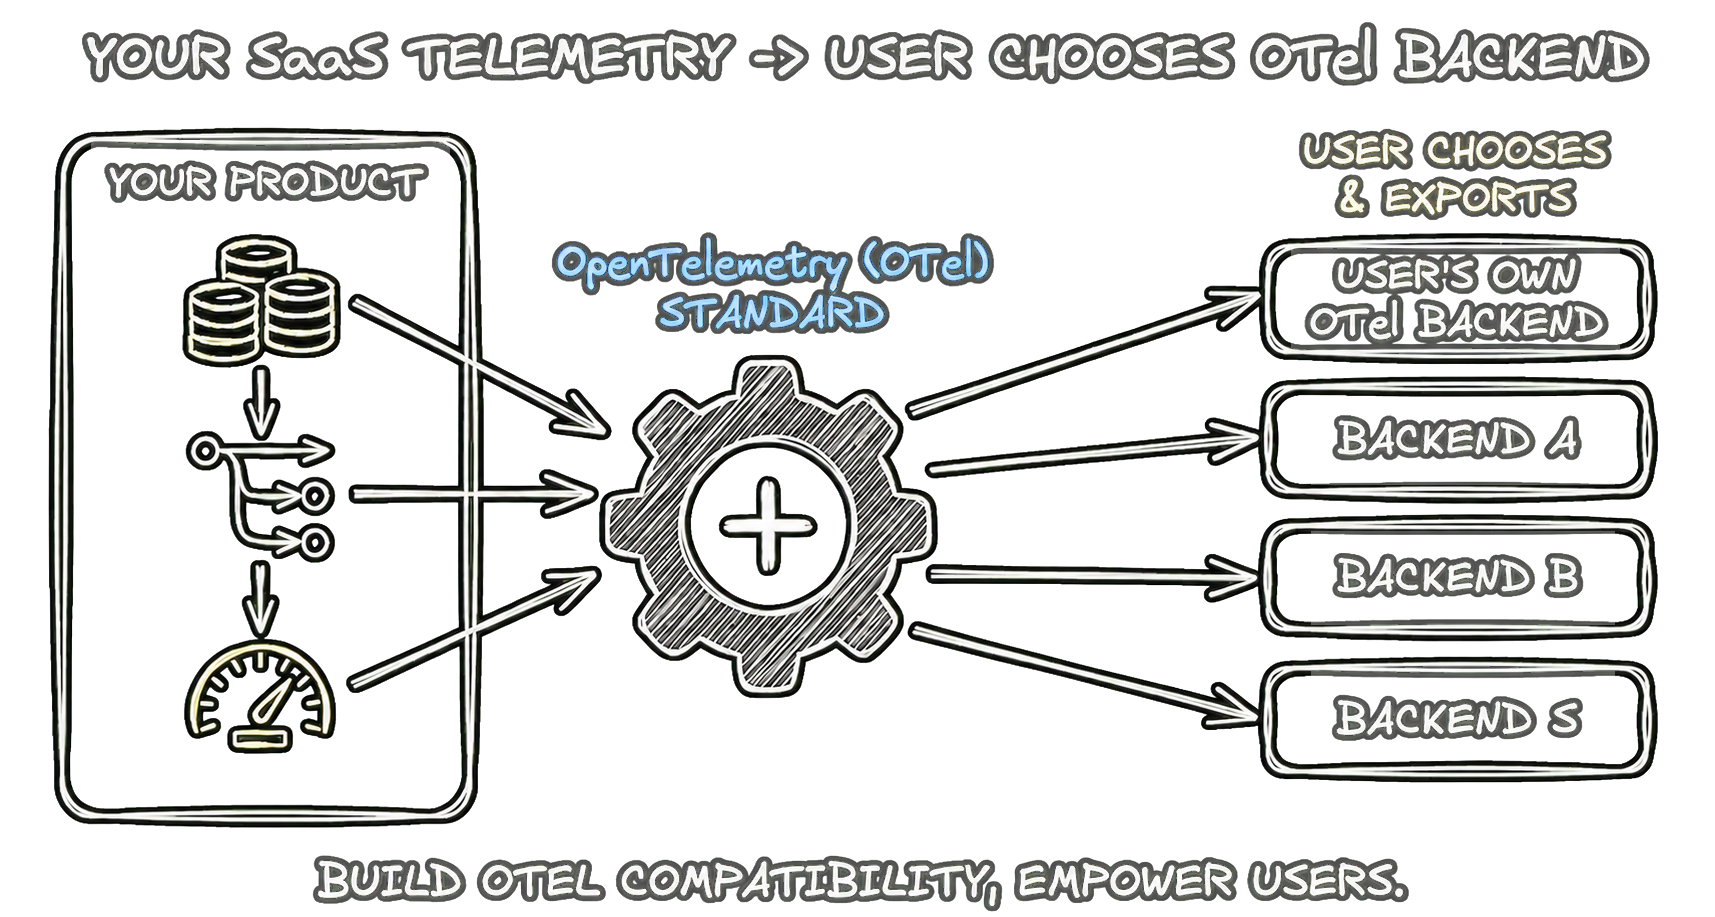
This image supports the introduction of the OTel‑native approach, showing how OTLP lets users select any observability backend without custom adapters.
A solid OTel‑native export story rests on four key properties: vendor‑neutrality (users can point at any OTel‑compatible collector or backend), no deep custom development (users integrate via standard OTel SDKs and OTLP), preservation of rich context (metadata, timestamps, and trace/span correlations are retained), and adherence to Semantic Conventions so data remains standardized and interpretable across backends. OpenTelemetry defines four signal types—logs (event and application logs), traces (distributed traces and spans), metrics (counters, gauges, histograms), and profiles (resource‑usage samples, currently in public alpha). Depending on who runs the system that produces the telemetry, the implementation differs: for self‑hosted software the product is instrumented with OpenTelemetry and exposes configuration flags for an OTLP endpoint (e.g., via environment variables or a config file), as seen in Kuma and Keycloak; for cloud platforms the provider offers a feature such as “Telemetry Drains” or “Observability Destinations” that collects telemetry from user workloads and first‑party services and forwards it to a customer‑defined OTLP endpoint, exemplified by Cloudflare Workers and Heroku.
Push‑based export using OTLP is preferred over traditional polling APIs because it delivers near real‑time data, avoids placing operational burdens on users to build and maintain polling pipelines, and automatically preserves contextual relationships like linking log records to parent trace IDs. While this model works well for logs, traces, and metrics, some implementations still have gaps: Cloudflare Workers does not yet support metrics export, and Keycloak’s log export remains in preview and is disabled by default. These limitations show that achieving full OTel‑native support across all signals requires ongoing work, but the core pattern provides a future‑proof, vendor‑neutral foundation that works with any observability stack users choose.