The author issued a single prompt to Claude Opus 5.5: “Make a three.js (pnpm) visualization of all Invisible Cities by Italo Calvino. Don’t ask questions, it is a one-shot task. You have 6h of work, use it until it becomes a masterpiece.” The model was allowed up to six hours to produce the visualization. According to the blog post, Opus 5.5 reported using roughly half of the allotted time, finishing in 1 hour 25 minutes while running six subagents in parallel, and the API cost was about $74.
The output is an interactive atlas where each of the fifty‑five cities from Calvino’s book is represented as a procedurally generated miniature diorama standing on a shared chessboard. Users can switch between three layouts—Atlas, Journey, and Chapters—and navigate with keyboard shortcuts such as arrows to move between cities, T for tour mode, C for contents, and H to hide the interface. The atlas is live at https://p.migdal.pl/invisible-cities-opus-5.5/ and its source code is publicly available on GitHub under the repository stared/invisible-cities-opus-5.5.
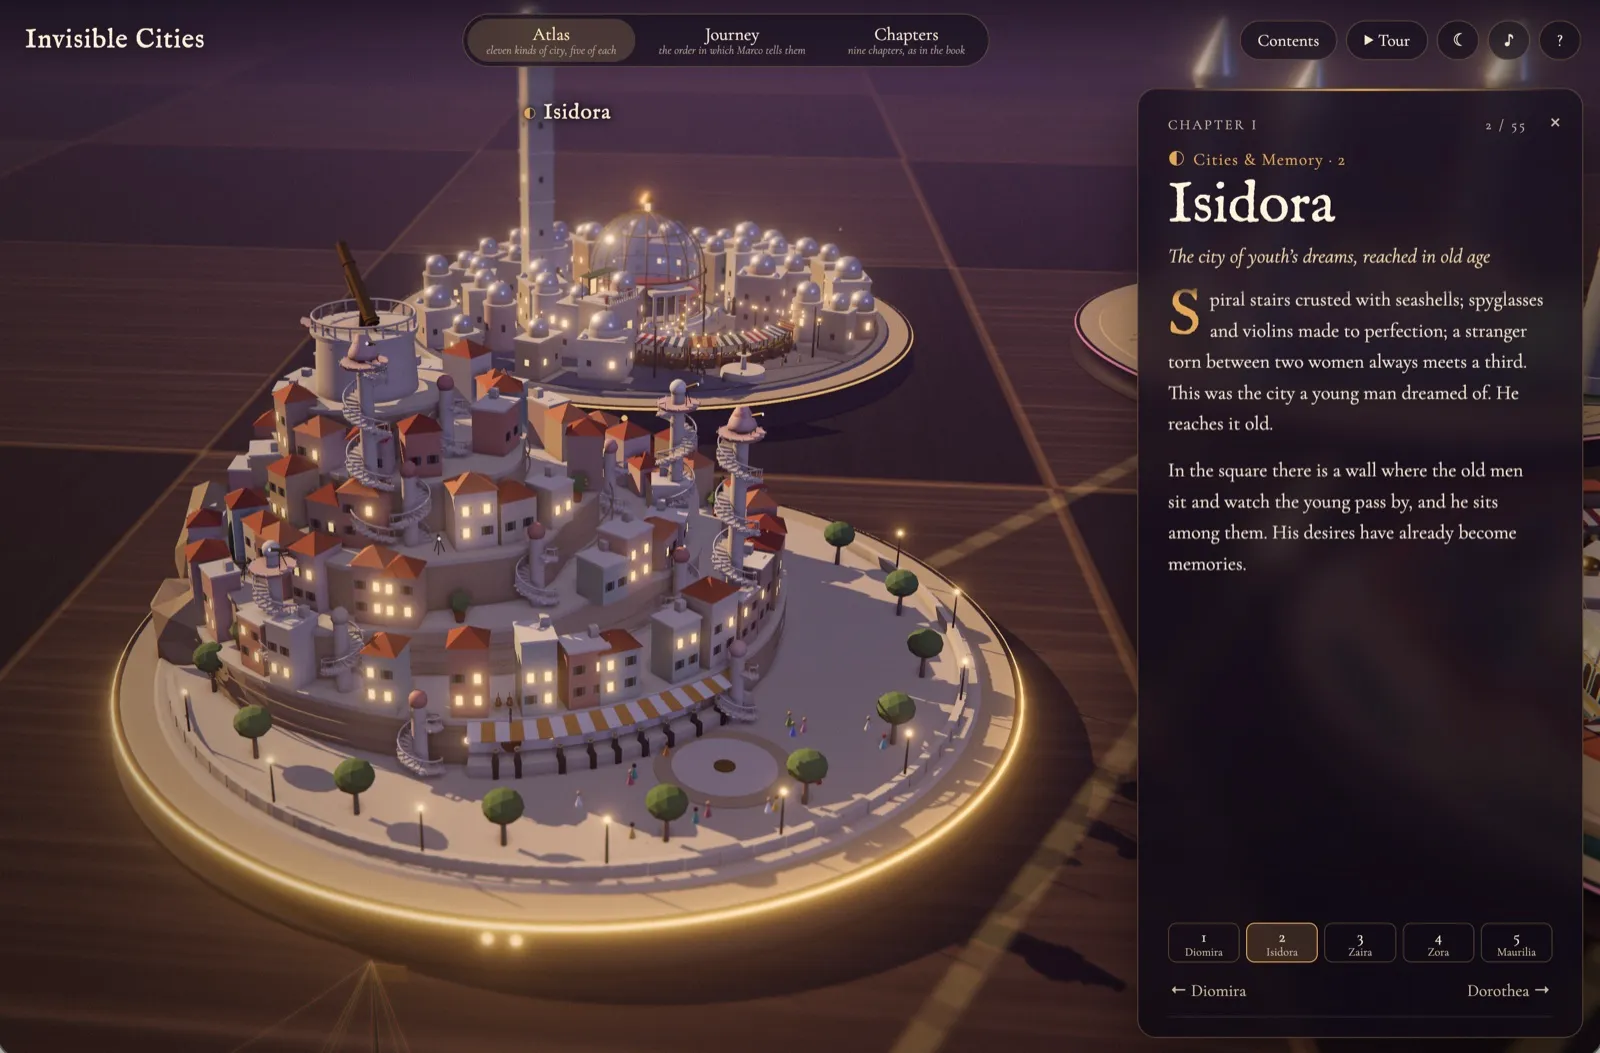
This image shows one of the fifty-five procedurally generated city dioramas created by Claude Opus 5.5 for the interactive atlas, illustrating the model's ability to produce detailed visualizations from a single prompt.
For comparison, the same prompt given to GPT‑6 Astra was completed in 53 minutes at medium effort for an approximate cost of $10 in API tokens, while earlier models such as Claude Fable 5.1 required more hand‑holding to achieve a comparable design. This illustrates Opus 5.5’s stronger design capabilities, albeit at higher token expense, and hints at a trade‑off between output quality and resource consumption.
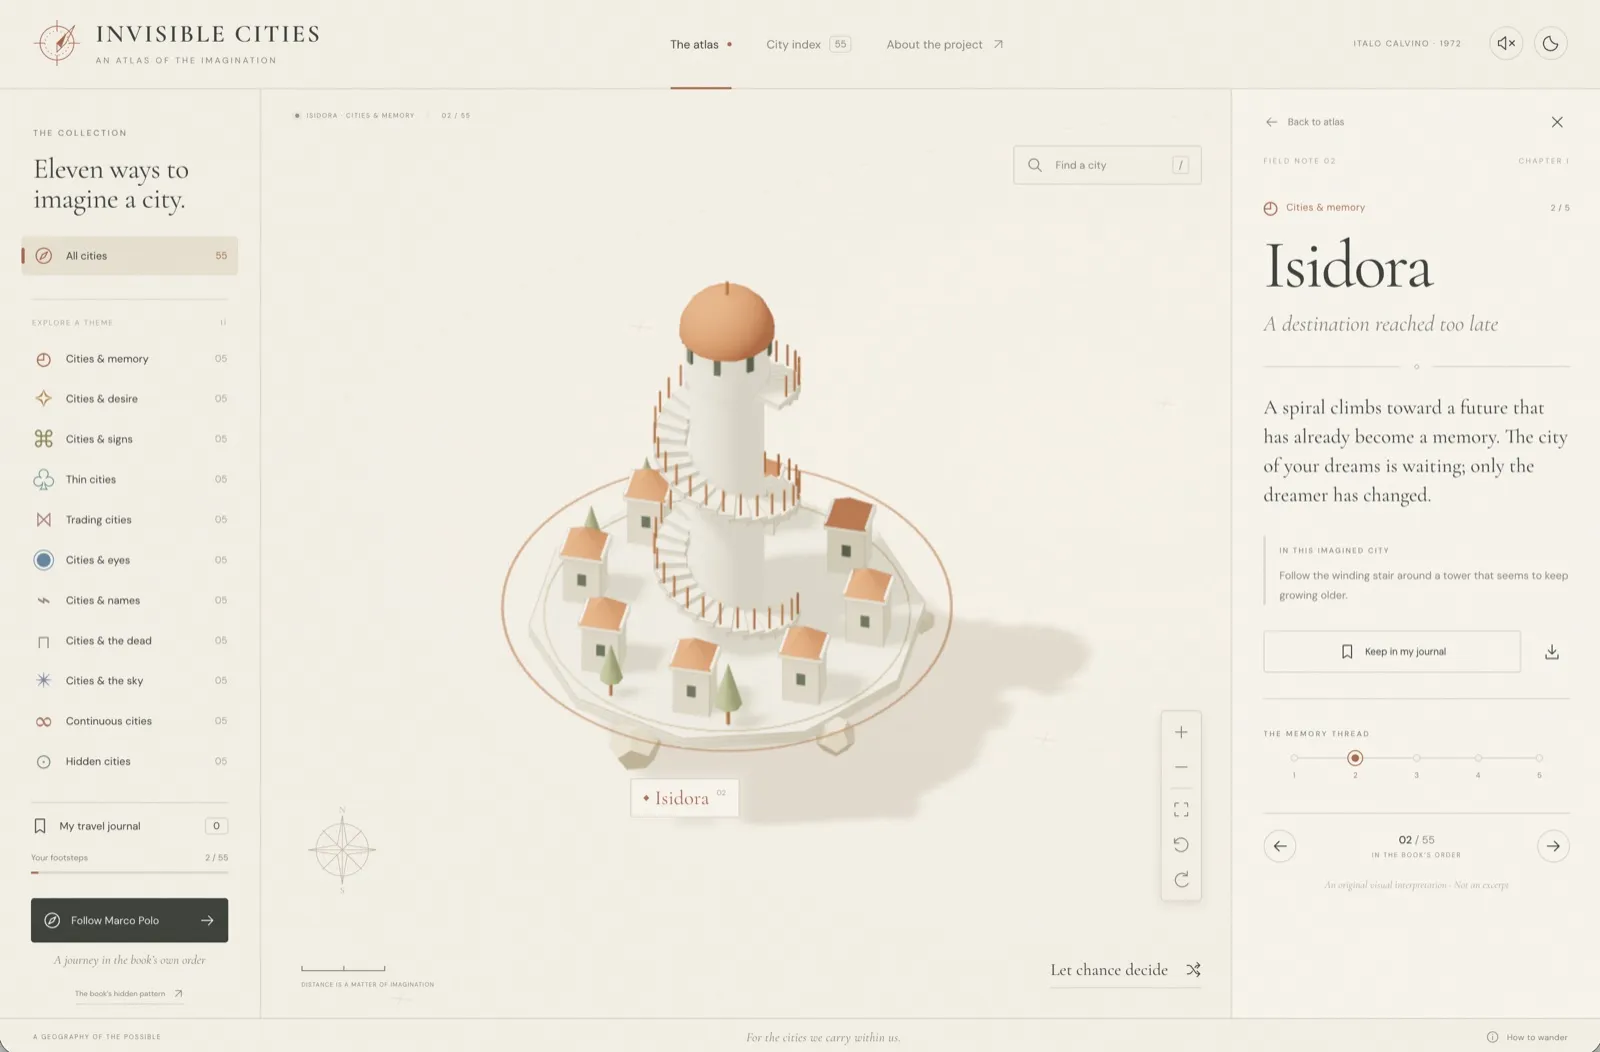
The article compares Claude Opus 5.5's atlas with GPT-6 Astra's output; this image shows the GPT-6 Astra visualization of Isidora, highlighting differences in visual style and computational efficiency.