Burning Man, the week‑long gathering of roughly 70,000 participants in Nevada’s Black Rock Desert, recorded three deaths during the 2026 event—a figure that drew attention because the conference has historically reported almost no fatalities. To determine whether three deaths is unusually high, the author first asked how many deaths would be expected if the attendees were a random sample of the U.S. population.
Using the crude all‑cause mortality rate of 909.3 deaths per 100,000 person‑years, the expected deaths for 70,000 people observed for one week is about 12.2. Because Burning Man’s population is far younger than the national average, the author applied age standardization: he applied each age‑specific U.S. death rate to the number of Burning Man attendees in that age bracket. This yielded an expected average of 4.9 deaths for the same person‑weeks. Modeling death counts as a Poisson process with mean 4.9 gives a probability of observing three or fewer deaths of roughly 27 %, so the 2026 total is not statistically abnormal after adjusting for age.
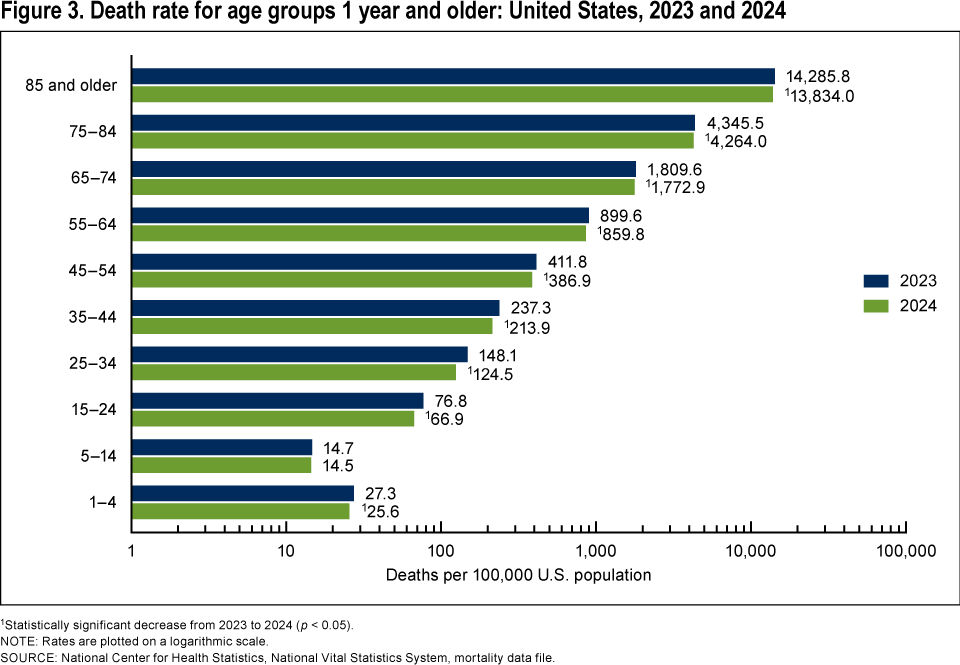
The age-specific death rates visualized here are the basis for the age‑standardization calculation that reduces the expected deaths from 12.2 to 4.9 for the Burning Man population.
Yet the long‑term record tells a different story. Excluding 2026, only about nine deaths have been recorded over Burning Man’s three‑decade history. If the age‑standardized rate of 4.9 deaths per event were correct, roughly 97 deaths would be expected over that span. The observed deficit produces a p‑value on the order of 10⁻³⁰, allowing rejection of the 4.9‑deaths‑per‑event hypothesis. Consequently, the true death rate at Burning Man is almost certainly lower than the age‑standardized estimate, a result the author attributes to selection bias: healthier, more affluent, and better‑educated individuals self‑select into the event, while those at higher risk of death are filtered out before they arrive.
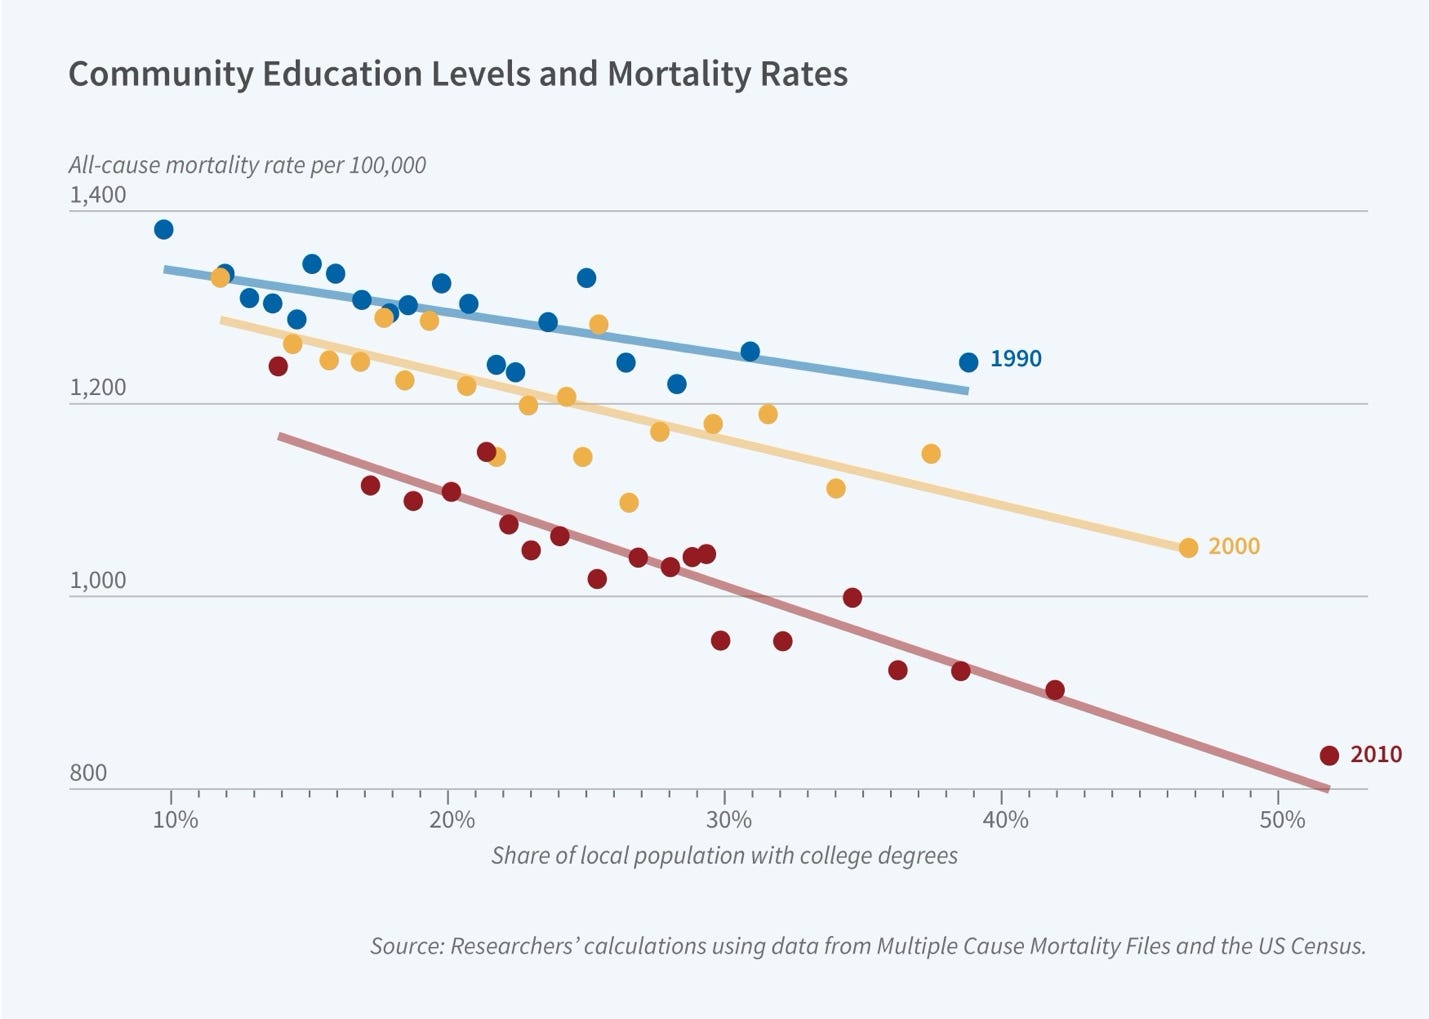
The figure demonstrates a negative relationship between the proportion of college‑educated people and death rates, reinforcing the idea that self‑selection of educated individuals reduces mortality at the event.
The author notes that with only three deaths in a single year the statistical uncertainty is large—about 58 % (1/√3)—and the 95 % confidence interval for the expected count spans roughly 0.6 to 8.8 deaths. While adding further standardization for race, income, sex, or education would shift the estimate slightly, those factors have much smaller effect sizes than age. The remaining gap between expected and observed mortality likely reflects influences that simple demographic slicing cannot capture, such as the willingness and ability to endure a week in desert heat, which remains unquantified.
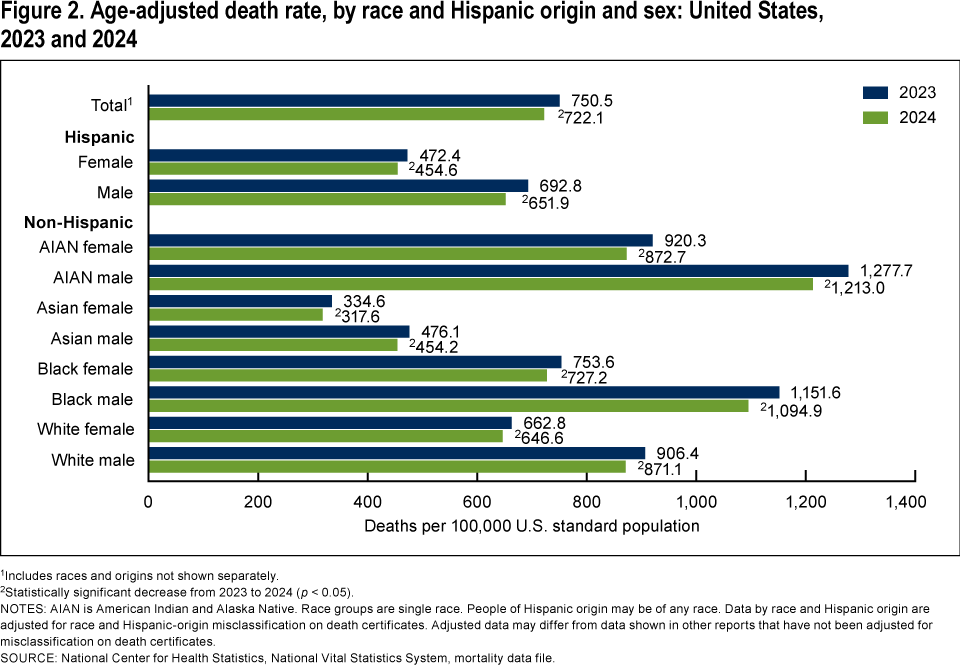
These age‑adjusted rates indicate that adjusting for race or sex would change the expected death toll only slightly, consistent with the article’s claim that such factors have minor impact compared to age.