The modern data stack has undergone a significant 'unbundling.' Historically, business intelligence tools were full-stack platforms handling everything from data ingestion and transformation to final visualization. Today, these layers are often separated: compute is handled by major cloud providers, ingestion by dedicated tools, and transformation by platforms like dbt. This leaves the BI tool primarily responsible for the final presentation layer—the charts and interactive interfaces. However, as AI agents become a primary interface for generating reports, the preference for 'clicking' over 'writing' is shifting. Agents are more proficient in code, SQL, and Git than they are navigating the complex, proprietary user interfaces of traditional BI software.
When users ask an AI agent to generate a report today, the agent often produces a disorganized collection of files—HTML, CSS, JavaScript, and various chart libraries. This 'messy freedom' of code makes it difficult for humans to audit the results and forces the agent to expend more time and tokens on every change. Conversely, traditional BI tools offer 'narrow control' by providing a governed UI, but they limit the agent to only what the interface exposes. dbt Charts proposes a third option: a structured YAML language that allows a full interactive dashboard to be declared in a single, auditable file. In this system, SQL defines the data, while YAML defines the visual presentation, including prose via Markdown and variables via Jinja.
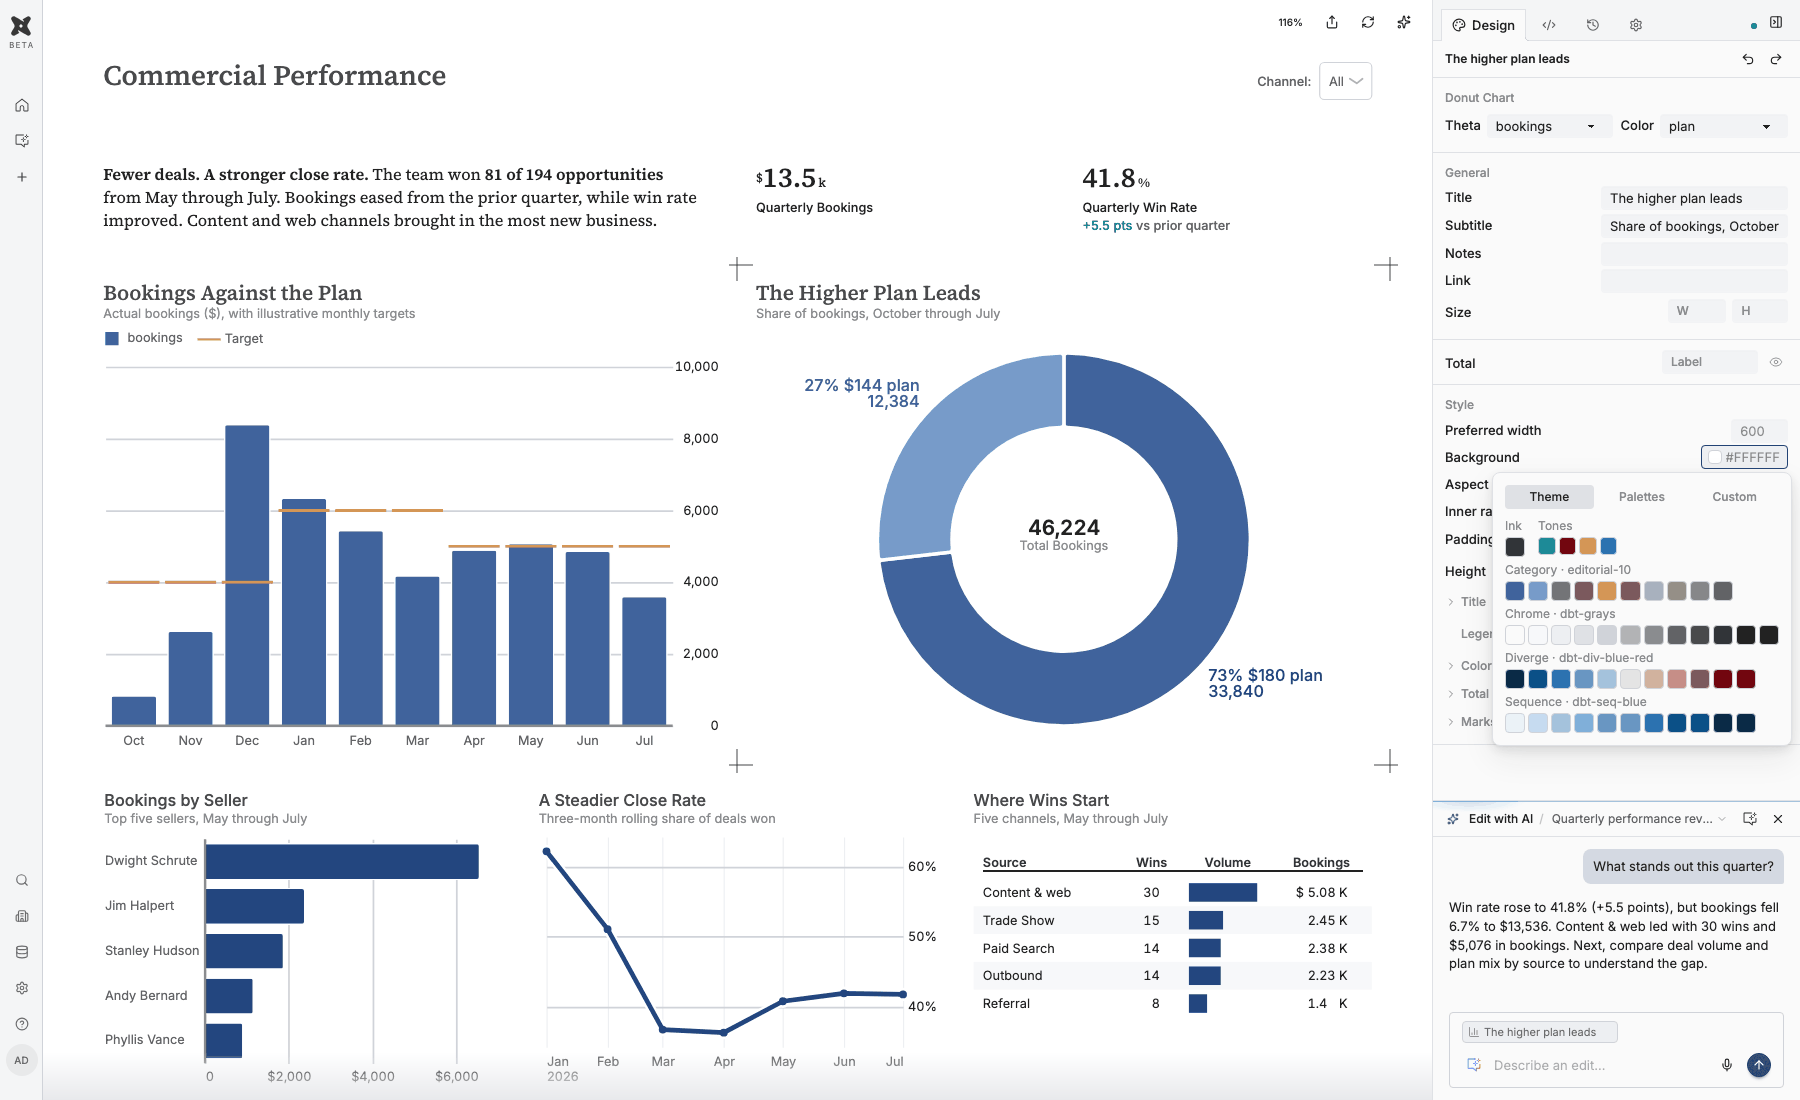
The dbt Charts workspace allows for a cohesive design language where users can interact with dashboards and AI agents.
By moving charts into the same Git repository as data models, dbt Charts integrates visualization directly into the development lifecycle. This allows teams to use shared CI/CD pipelines where a change to a data model and its corresponding chart can be validated and shipped in a single branch. The system includes a CLI that renders these YAML files into various formats, such as SVG, HTML, or PDF. While dbt Charts provides the language for these declarations, the developers also launched a hosted platform to handle the remaining 'unbundleable' aspects of BI, such as identity management, hosting, and permissions for non-technical users.
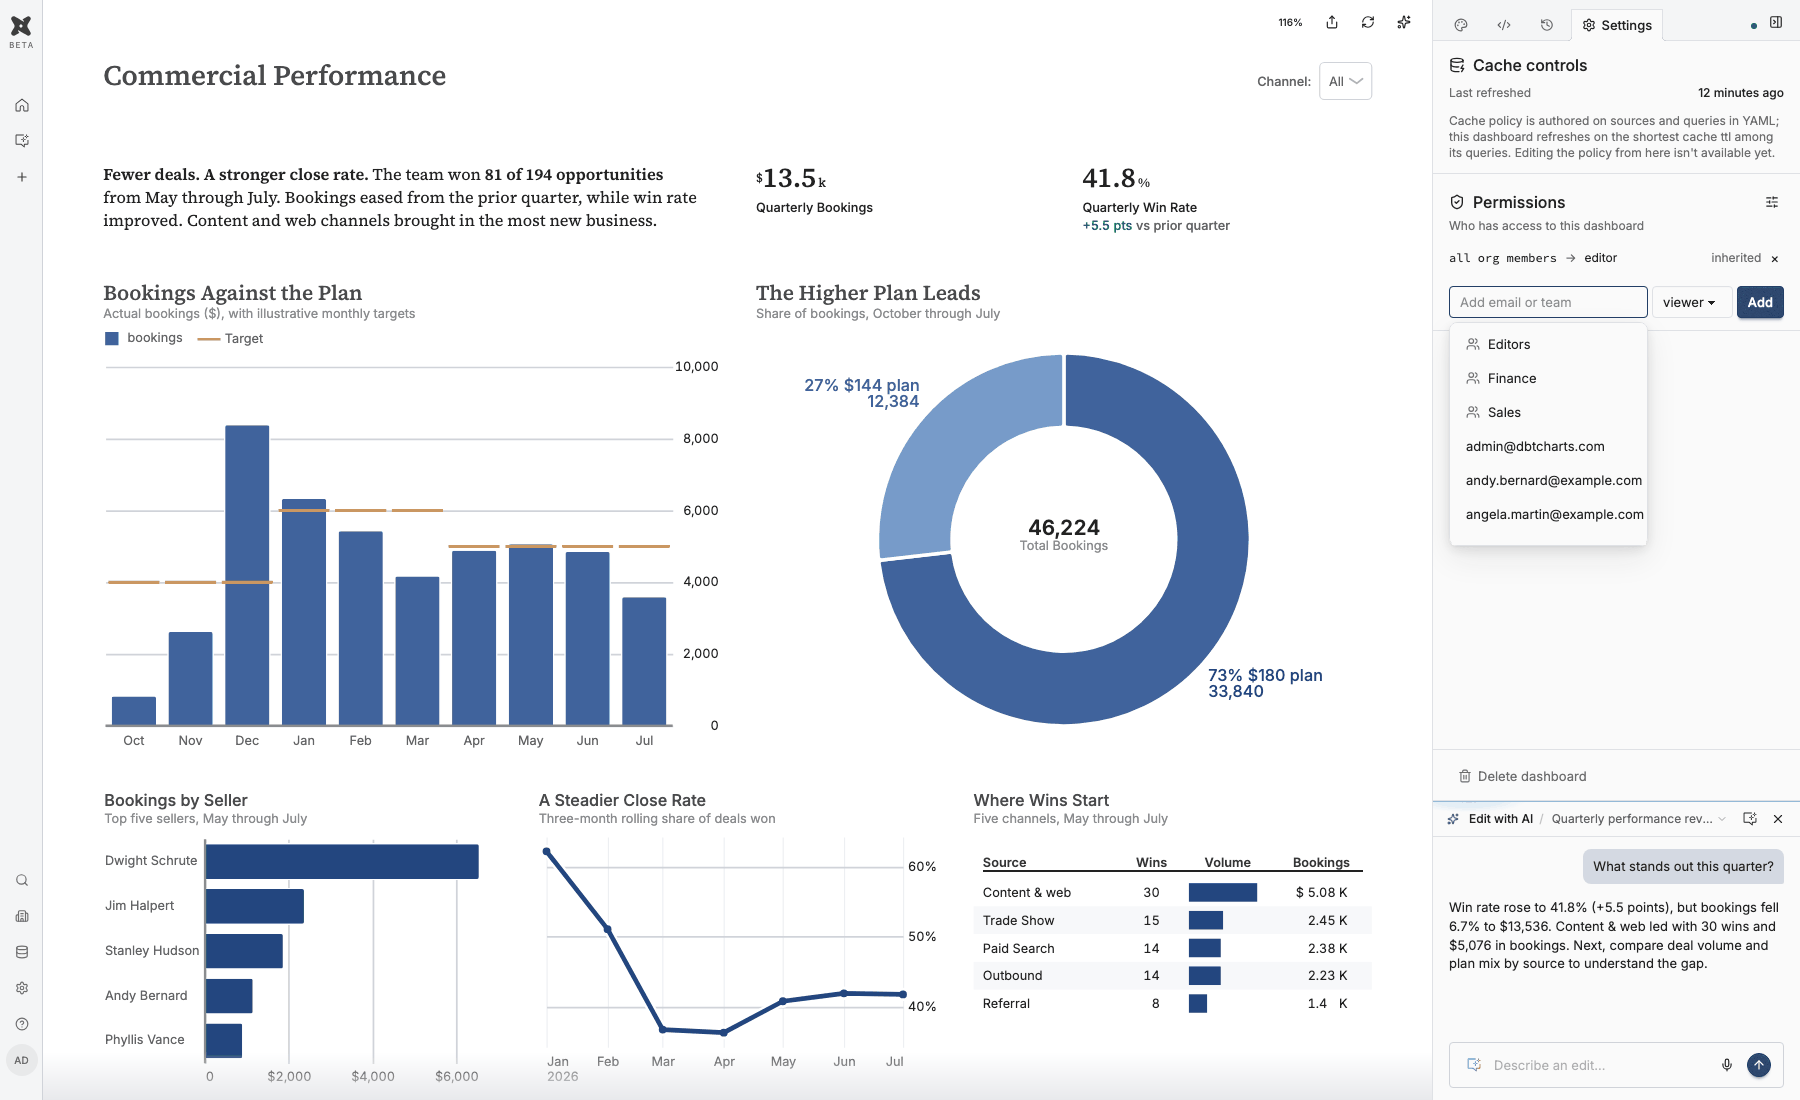
The developers launched a hosted platform to handle identity management, hosting, and permissions for non-technical users.
One specific limitation of this approach is the trade-off between the freedom of code and the accessibility of a UI. While dbt Charts makes it easier for agents to build and humans to audit dashboards as code, it still requires a hosted environment or a local rendering setup to make those dashboards accessible to the broader organization. Furthermore, while the system provides a cohesive design language for charts, the specific performance differences in 'token costs' or execution speed compared to traditional BI tools remain an area for further observation as the tool matures toward its 1.0 release.
Ultimately, dbt Charts seeks to establish a new standard where the dashboard layer of the data stack is as version-controlled and transparent as the data transformations that power it. By providing a declarative bridge between SQL and the final visual, it aims to create a workflow where humans and AI can collaborate on data presentation without the friction of proprietary UI constraints or the chaos of unmanaged code artifacts.
What Hacker News readers are saying
- Alternative: One commenter pointed out that Malloyyo and Publisher serve as alternatives that allow for free use anywhere, whereas dbt Charts may require their hosting service for production. comment ↗
- Skeptical: A commenter expressed skepticism regarding the use of YAML as a language, arguing that it can become overly complex for variable binding and conditionals compared to true programming languages. comment ↗
- Skeptical: Another user questioned whether the tool addresses the broader BI value proposition, such as governance, access controls, and semantic layers, beyond just the visualization of raw SQL. comment ↗
- Experience: One commenter shared their experience building agents that generate SVG charts directly, suggesting that a library might be helpful but is not strictly necessary to achieve high-quality results. comment ↗
Summarized opinions from the Hacker News thread, not verified facts. Read the full discussion ↗